2010-02-01
Abstract
Advanced memory analysis allows for rapid assessment of potentially hostile executables in memory. Ken Dunham takes us through the three phases of operation in detail: triage, capture and analysis.
Copyright © 2010 Virus Bulletin
Cybercriminals are pushing fraud to the limits, now resorting to memory-only tactics to subvert the Windows operating system for financial gain. These recent tactics pose a challenge for traditional forensics, law enforcement, auditing and incident response procedures, and require new ways of dealing with affected systems. Advanced memory analysis allows for rapid assessment of potentially hostile executables in memory. There are three distinct phases of operation: analysis of a live system (triage), dumping of volatile data to a file (capture), and analysis of combined data (analysis).
Incident handlers often locate infected computers through egress traffic via IDS/IPS-type solutions. Once a computer is known to be sending suspect or known hostile traffic, the hunt begins to find the offending process, image files, and scope of compromise. While some malicious programs hide data in Alternate Data Streams (ADS) and other tricky places, a movement towards kernel-level rootkit subversion and RAM-only code is underway in the wild. As a result, incident handlers who are not equipped with advanced stealth code identification tools and techniques are unable to triage a system properly to identify potential kernel-level rootkits on an infected host.
Triage begins with the age-old basics of incident handling and forensic techniques. Ideally, policy enables the incident handler to collect information relating to volatile data on the system. If policy only allows a hard-core traditional forensic approach, critical volatile RAM-only data will be lost. To focus on memory analysis and volatile data, incident handlers must begin triage with operations such as the following, which are largely focused on malicious process and image identification:
If the Task Explorer won’t open, this is a sign that malicious code may be hindering the use of security tools on the system.
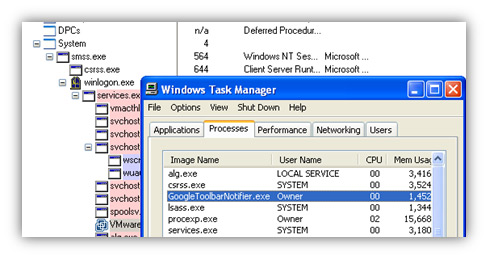
Once the Task Explorer is open, look for anything in the list of processes that shouldn’t be there. While it is increasingly rare, malicious programs do sometimes still reveal themselves in Windows Task Explorer. Even when something is visible in memory, other components of an attack may be hidden.
Also look for anything that is missing from the list of processes. For example, one variant of Haxdoor injects explorer.exe and then hides the process it injects. Explorer.exe should always be visible within Windows Task Explorer; if it isn’t, a rootkit is probably hiding it.
Following the same procedures as when working with Windows Task Manager, look for extra and/or missing processes such as explorer.exe, csrss.exe and lsass.exe. Although it is increasingly unlikely that any rootkit processes will be found using this method, it is worthy of investigation since some malicious programs are visible using this tool but not with Windows Task Manager, indicating a possible rootkit process.
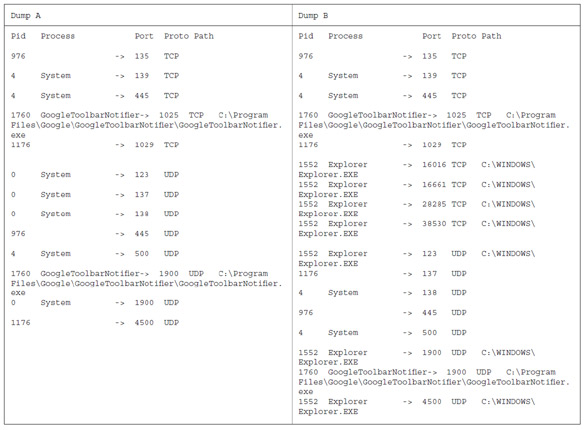
Run F-Port and dump the results to a file. It is a good idea to have a baseline dump from a known clean system to compare against the dump from the possibly infected system. This enables the incident handler to identify what F-Port has seen in memory mapped to specific ports and file images at the time of analysis, and to quickly identify what might be malicious.
Looking at the dumps shown in Figure 2, can you identify which one is from an infected system? Column B is longer for a reason: several new processes have been spawned by explorer.exe. This suggests an injected malicious process attempting to communicate with a remote C&C server.
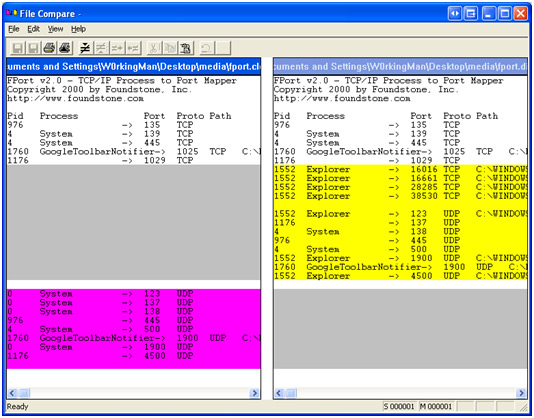
By performing a standard ‘diff’ or difference analysis (common in the forensics field), an incident handler can very quickly identify potentially hostile processes. To do this even more quickly, consider using the FCompare utility (http://www.oneysoft.com/fcompare.htm), which highlights changes between dump files of this nature using the File:Compare option. While not perfect, this can be useful for rapid triage of larger dump files compared against baseline dumps.
In Figure 3, FCompare highlights the changes between two F-Port dumps, showing potentially malicious processes in yellow on the right.
TCPView is a great tool for a quick visual overview of any running processes that are responsible for TCP communications. Since many trojans and other malicious codes attempt to communicate with remote C&Cs via TCP, this is a great way to identify potentially hostile activities. In the example shown in Figure 4, notice that several ports related to the ‘non-existent’ process as identified by TCPView, are all in the listening state.
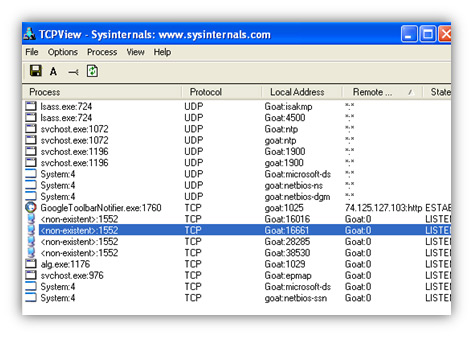
Figure 4. TCPView shows that several ports related to the ‘non-existent’ process are in the listening state.
TCPView reveals several new ‘non-existent’ TCP processes related to the Haxdoor rootkit.
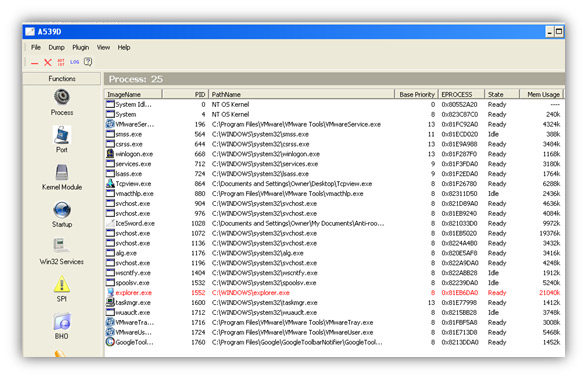
IceSword highlights any data it believes to be associated with rootkit activity. This can be a great visual when it works properly, as in the example shown in Figure 5 where Haxdoor has injected explorer.exe.
In the example of Haxdoor, IceSword is able to show rootkit components in many areas, including but not limited to a hostile process highlighted in red, new processes listening (not in red), system service descriptor table (SSDT) hooks, log/thread creation activity, and hidden files in the Windows System32 directory. Analysis of other areas, such as the Windows registry, are also possible using this powerful tool.
Comparing a Windows file listing of the System32 directory against an IceSword file listing of the same directory can also reveal hidden files, as shown in Figure 6. Common locations for concealing malcode are in the System32, Windows, and various related directories.
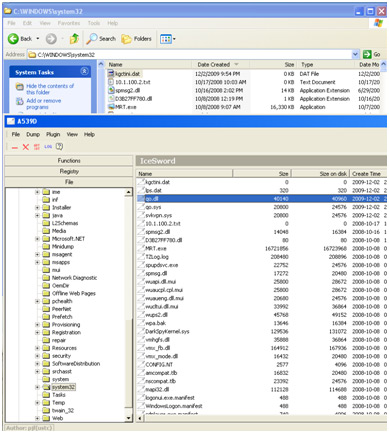
Figure 6. Files appear within IceSword that are not visible within Windows itself, revealing a rootkit running on the system.
Hint: A good way to compare directories is to sort by created date. Simply right-click on the headers for file listings and select ‘Date Created’ and then click on the tab after creation to sort in the order desired.
With triage completed, there may be clues that a rootkit is running on the system. In some cases an incident handler will already have captured hostile image files using tools like IceSword and/or forensic techniques. If further investigation is required, capturing physical memory to a file is the next step. Image files are then analysed using the Volatility Framework and/or advanced reverse engineering techniques.
Several utilities exist to image physical memory (dump volatile data to a file). Raw image files of physical memory are DD-style copies of the memory but do not contain processor state. This enables an incident handler to compare what is found inside a dump file to what was found at the triage stage. Additionally, processes in memory – including hidden hostile executables – can be extracted from an image file for analysis.
Several tools exist to quickly dump physical memory to an image file. Dumps typically take several minutes and can be quite large: on average 3GB to 4GB and upwards. It is common to dump to the C: drive in order to locate and extract images and other data quickly.
Win32dd is a free tool that can be used to dump physical memory to a file. It supports Windows 2000 to Windows 7 and is capable of producing a full snapshot similar to a Microsoft crash dump file. Win32dd is a very intuitive, easy-to-use tool that does a great job of imaging quickly. When running it in a CMD window it is wise to navigate to the directory containing the executable to avoid the errors that might appear if the SYS file can’t be located (e.g. ‘cannot start the driver’).
win32dd -r C:\filename.dmp
-r = raw memory dump/snapshot
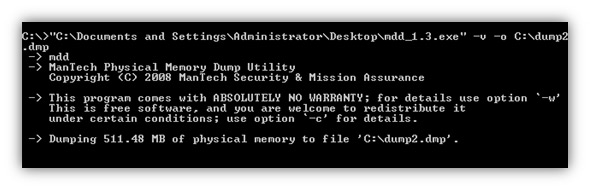
MDD is another tool that can be used to dump physical memory to a file. It is open source, hosted by SourceForge. It supports Windows 2000, XP, Vista and Windows Server. This program was not very stable in the limited tests I performed, but it did the job well when crashes did not occur.
mdd -v -o C:\filename.dmp
-v = verbose; -o = output file followed by path/name
Memoryze is a powerful tool, but it requires a set-up installer to be run before it can be used – this is not usually possible in an incident management situation. Furthermore, the output is best analysed using other Mandiant tools that have similar set-up requirements and customized interpretations. This tool is more useful for in-depth investigations or in environments where such tools are used across the enterprise rather than individually for incident handling.
If Memoryze is to be installed and used, a directory must be created for dump data. Once such a directory has been created, the tool is able to dump memory using a batch file as shown below:
MemoryDD.bat –output <directory_name>
Located at C:\Program Files\Mandiant\Memoryze\MemoryDD.bat\ in most situations.
Mandiant has another tool called Audit Viewer which is useful for analysing Memoryze images and XML data. A specific Python solution is required to fully install and use the software.
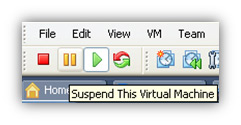
VMware is commonly used to test malicious codes and to research emergent threats. If code runs inside VMware, or a virtualized desktop is in use, analysis of a .vmem file is another option for determining what is in memory on a suspect host. Simply click on the VMware ‘suspend’ button to create a ‘.vmem’ file on the host system. Use this image file for advanced memory analysis.
Dcfldd is yet another method of creating an image file. The syntax can be a bit tricky with forward and backslash conventions:
dcfldd if=/dev/mem of=c:\filename.dmp conv=sync,noerror
Once physical memory has been captured to an image file you have a huge file with a bunch of data within it waiting to be discovered. Incident handlers should now have a very good idea of what might be malicious, or where to look on a system. The goal now is to use the Volatility Framework to extract executables of interest in memory and to compare the image file against earlier triage data in a diff analysis.
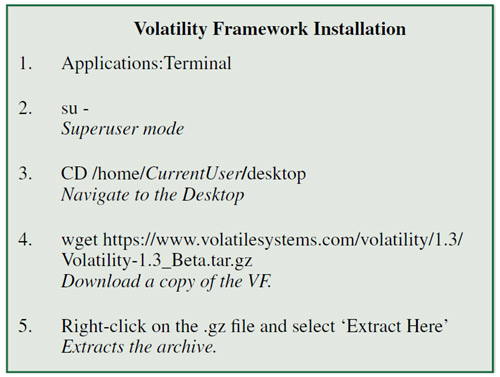
I prefer to use a Ubuntu build to install the Volatility Framework. Install details are shown in Figure 9. Common installation pitfalls include not entering into SU mode (which is required for installation); downloading to the root directory and wondering where the download is when done (see CD in step 3 to mitigate); and not using Terminal properly to run the Python Volatility file.
Once installation is complete, Volatility Framework commands can be run against the image files copied into the analysis system. Open the terminal and navigate to the Volatility Framework directory on the desktop. Then enter the following command to view options for the tool:
python volatility --help
A sample dump of the options provided by the Volatility Framework are below. Items in bold are of greatest interest to an incident handler attempting to compare triage data against what is found in the physical memory image file and/or capture of hostile hidden binaries on the system.
usage: volatility cmd [cmd_opts]
Run command cmd with options cmd_opts
For help on a specific command, run ‘volatility cmd --help’
Supported internal commands:
connections   Print list of open connections
connscan      Scan for connection objects
connscan2     Scan for connection objects (New)
datetime      Get date/time information for image
dlllist       Print list of loaded dlls for each process
dmp2raw       Convert a crash dump to a raw dump
dmpchk        Dump crash dump information
files         Print list of open files for each process
hibinfo       Convert hibernation file to linear raw image
ident         Identify image properties
memdmp        Dump the addressable memory for a                                                                            process
memmap        Print the memory map
modscan       Scan for modules
modscan2      Scan for module objects (New)
modules       Print list of loaded modules
procdump      Dump a process to an executable sample
pslist        Print list of running processes
psscan        Scan for EPROCESS objects
psscan2       Scan for process objects (New)
raw2dmp       Convert a raw dump to a crash dump
regobjkeys    Print list of open regkeys for each process
sockets       Print list of open sockets
sockscan      Scan for socket objects
sockscan2     Scan for socket objects (New)
strings       Match physical offsets to virtual                                                                    addresses (may take a while, VERY                                                       verbose)
thrdscan      Scan for ETHREAD objects
thrdscan2     Scan for thread objects (New)
vaddump       Dump the vad sections to files
vadinfo       Dump the vad info
vadwalk       Walk the vad tree
Supported plug-in commands:
memmap_ex_2   Print the memory map
pslist_ex_1   Print list running processes
pslist_ex_3   Print list running processes
usrdmp_ex_2   Dump the address space for a process
Example:
volatility pslist -f /path/to/my/file
To get specific parameters and help on commands of interest, use the syntax ‘python volatility command --help’. For example, ‘python volatility pslist --help’ produces the following list of options for the pslist command:
Usage: pslist [options] (see --help)
Options:
-h, --help show this help message and exit
-f FILENAME, --file=FILENAME (required) XP SP2 Image file
-b BASE, --base=BASE (optional, otherwise best guess is made) physical offset
   (in hex) of directory table base
-t TYPE, --type=TYPE (optional, default=‘auto’) identify the image type (pae,
   nopae, auto)
When running the command ‘python volatility pslist –f dump.dmp’, where dump.dmp is the file containing physical memory, the Volatility Framework provides the sample output shown in Figure 10.
The list in Figure 10 clearly shows Win32dd, FPort and other processes in memory along with their process IDs. Comparing this against triage data and correlating PIDs is the first step in performing advanced memory analysis diff comparisons to discover hidden processes. Once a hostile process is identified, the Volatility Framework can be used to dump it to an executable file for further analysis. In the example statement below, a hostile process with the PID value of 1004 is dumped to an executable file for further analysis:
python volatility procdump -f dump.dmp -p 1004
NOTE: If you don’t specify the PID value, all processes will be dumped to executable files.
Extracted binaries enable researchers to scan files to see if they are infected by malicious code, perform reverse engineering, and more. Investigations should start with a strings analysis. Most processes are not obfuscated or packed while in memory, thus allowing plenty of opportunities for strings analysis. In some cases URLs and other data can easily be seen when looking at strings of executables captured from a dump file.
Additional work can now be done both on the original infected system and in the analysis of memory data and extracted executables. Going back to the original system, anti-rootkit and forensic techniques can now be used to identify and extract specific image files of interest. Additionally, advanced analysis of extracted raw image data frequently leads to discoveries that can impact live system analysis and reverse engineering, URLs, remote server investigations and related abuse data, and more.
In next month’s issue, we will take a detailed look at the use of advanced memory analysis on a system infected with Haxdoor.